
En atención a la creciente preocupación sobre la confianza en...
Leer más
COVID-19 Stats: COVID-19* and Influenza† Discharge Diagnoses as a Percentage of Emergency Department (ED) Visits, by Year — United States, June 2018–March 2021
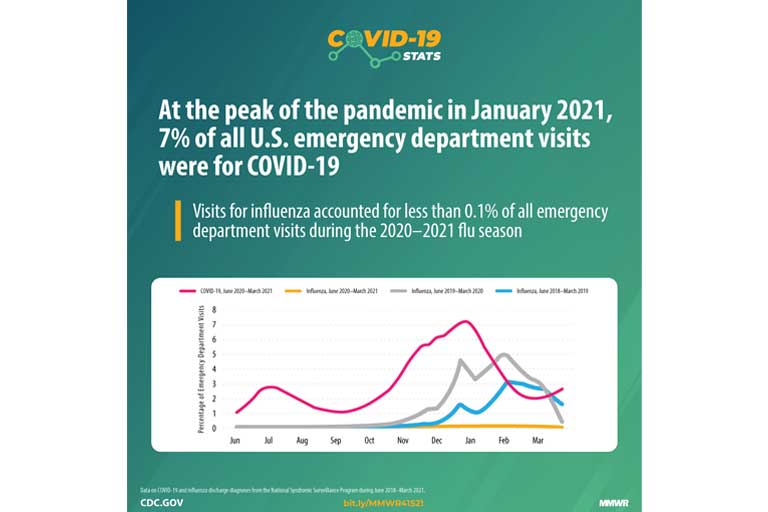

COVID-19 visits were identified using International Classification of Diseases, Tenth Revision, Clinical Modification (ICD-10-CM) and SNOMED Clinical Terms (SNOMED CT) diagnosis codes. ICD-10-CM codes included U07.1, COVID-19 and J12.82 (pneumonia due to coronavirus disease 2019). SNOMED CT codes included 840539006 (disease caused by SARS-CoV-2 [disorder]), 840544004 (suspected disease caused by SARS-CoV-2 [situation]), and 840533007 (SARS-CoV-2 [organism]).† Influenza visits were identified using International Classification of Diseases, Ninth Revision, Clinical Modification (ICD-9-CM), ICD-10-CM, and SNOMED CT diagnosis codes. ICD-9-CM codes included those beginning with 487 (influenza) and 488.01, 488.09, 488.11, 488.19, 488.81, and 488.89 (influenza due to certain identified influenza viruses with pneumonia and other manifestations). ICD-10-CM codes included those that start with J09 (influenza due to certain identified influenza viruses), J10 (influenza due to other identified influenza virus), and J11 (influenza due to unidentified influenza virus). SNOMED CT codes included 442696006 (influenza caused by influenza A virus subtype H1N1 [disorder]); 442438000 (influenza caused by influenza A virus [disorder]), 24662006 (influenza caused by influenza B virus [disorder]), 6142004 (influenza [disorder]), and 195878008 (pneumonia and influenza [disorder]).§ Data include ED visits from 71% of U.S. facilities in all states except Hawaii; some states have a higher proportion of facilities sending data than others. Data are presented as ED visits for influenza or COVID-19 as the weekly percentage of all ED visits during June–March for a given year.
In late June 2020, the percentage of ED visits for COVID-19 increased and reached a peak of 2.8% of all ED visits in early July before declining through August. This decline was followed by a larger and more prolonged increase beginning in September 2020 that reached a peak (7.2%) in early January 2021. Influenza activity generally begins in October with increased activity throughout the winter months. By the beginning of February 2018, the percentage of ED visits for influenza reached 3.1%, and by the beginning of February 2019, reached 5.0%. During June 2020–March 2021, ED visits for influenza accounted for less than 0.1% of all visits.
Source: National Syndromic Surveillance Program, June 2018–March 2021. https://www.cdc.gov/nssp/index.html
Reported by: Abigail Gates, MSPH, ovh4@cdc.gov; Taylor Dias, MPH; Katharina L. van Santen, MSPH; Michael Sheppard, MS.
More: https://bit.ly/MMWR41521.
Créditos: Comité científico Covid